Problem
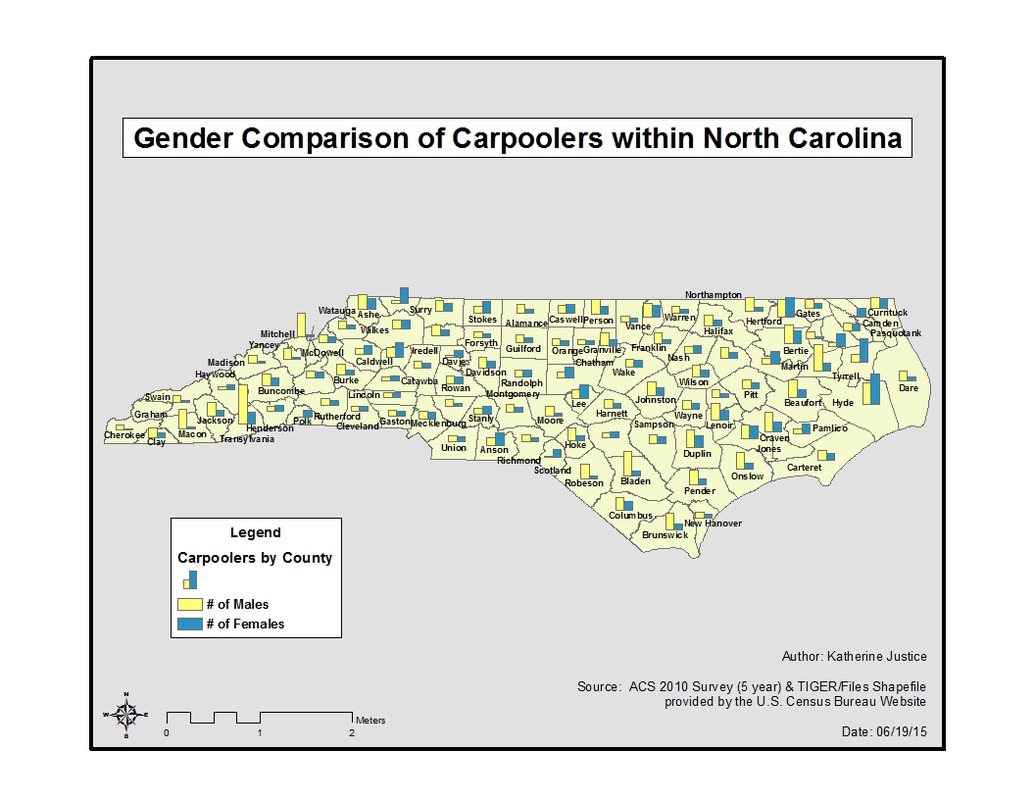
The problem presented in this exercise was created from a tabular dataset displaying the variety of means of transportation to work within all 100 counties of North Carolina. The problem is to create a visual comparison of number of carpoolers by sex. With this comparison we may be able to create a social connection to the quantity of males versus females who decide to carpool to work and their environment based on location across the state.
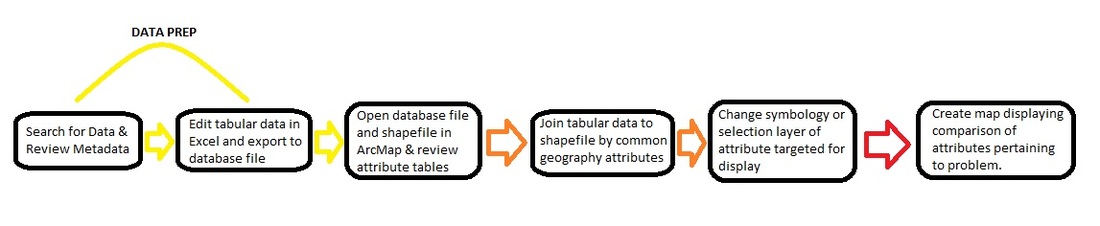
Analysis Procedures
The first step of my procedure was to research and find a dataset and a shape file that was compatible to each other by reviewing the metadata for common attributes. Once the data was downloaded, I edited my tabular dataset in excel. In this step I removed the decimals from the first three columns of excel, deleted the second row header, ensured that each column attribute had a unique name, and converted the GeoID2 attribute (identified earlier for the join) to a text format. I then was able to save as an Excel 97-2003 Workbook file and export it in Arc Catalog to a database file (single). Once the database file was created I opened it in ArcMap along with the NC counties shape file. From there I reviewed the attribute tables of each to make sure that all attributes carried over. Under the county shape file, I joined the two by the attributes CNTYIDFP00 and GeoID2. I then opened the attribute table of the joined data to ensure that there were no null values and an equal number of matches. With the successful join, I then changed the symbology of the shape file to display a bar chart of each county comparing the number of male carpoolers to female carpoolers.
Model:
Results
Map: The resulting map displays the use of census data for comparison of carpoolers by gender for each county.
Application & Reflection
The skills learned in this exercise go beyond the practical skills used to join attributes in the ArcMap software. I found the concept of researching and reviewing datasets base on search criteria to be the most helpful. I know that I can now use this skill to find any missing dataset or shape file that I may need for future projects for work or for school. This skillset can be used for a variety of similar problems. For example, I could use the census data to find out how many males compared to females work in an agricultural occupation, such as farming. For this I might download a dataset pertaining to Occupation by sex in the state of North Carolina. I can then narrow the dataset for analysis within ArcMap by agricultural occupations. This could be useful information when providing agricultural information of promotions to the public. It may also shed light on how farming is being extended from generation to generation.
