Problem
The assignment provides a data table providing a survey of jobs created throughout the country. This data must be matched to the corrected zip code locations which can then be used to determine how many jobs have been created based on NC house districts and NC Senate districts.
Analysis Procedures
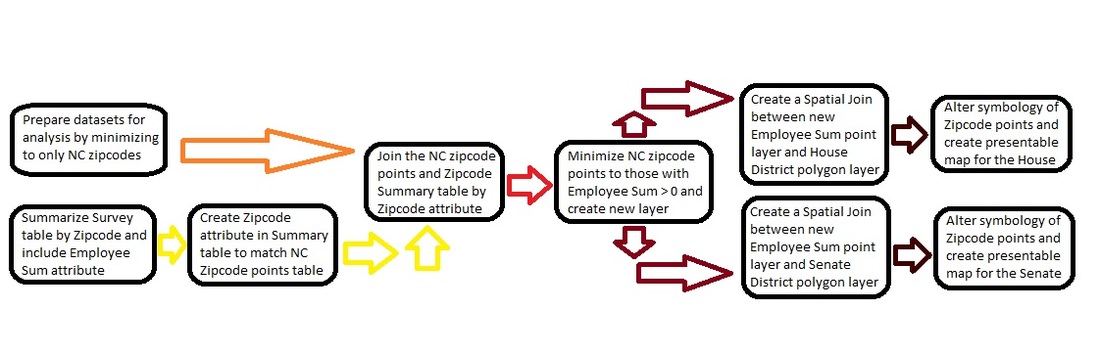
Before starting my procedure, I added all datum from NCSU, ArcGIS Online, and the GIS 520 course page. I prepared my data for analysis by adding the USA zip code points to the data frame and selecting and creating a new layer of only those points attributed to North Carolina. These points were then exported to a new shape file. From there I continued to prep my data for analysis by creating a new summary table from the Zip code column of the Employment Survey data table. The new summary table also included the employee sum statistics allowing me to easily compare the two. Within the new ZipcodeSum table, I created a new field named Zipcode_Text as a Text data type, and calculated the geometry of the column to match the Zip code (number type) column. The ZipcodeSum table was then joined to the NC zip code points shape file by the Zip code (text) columns in each. This resulted in a new NC zip code point’s layer with an attribute table containing employment information. I then used the select by attributes tool to minimize the dataset to those zip codes that had employment sums greater than 0. Once selected, these points were then exported to their own layer file named Employee Sum, and the symbology was changed to a graduated circle feature to indicate greater employment numbers by zip code. I then created a spatial join for each House and Senate polygon file with the Employee Sum layer and the sum of their attributes. From there, I was able to change labeling, symbology, and other aesthetics to create two separate maps representing the number of jobs created in both the House and the Senate districts.
Model:
Results
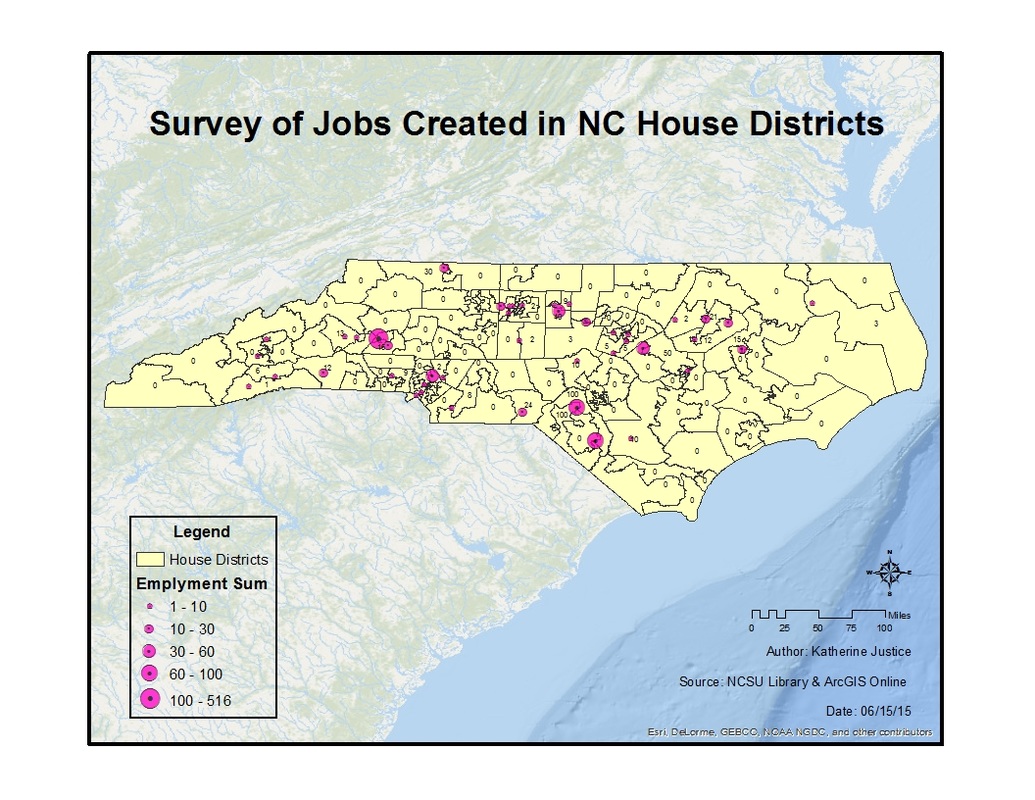
Map 1: Shows the number of jobs created in the North Carolina House of Representatives Districts based on the Employment Survey data table.
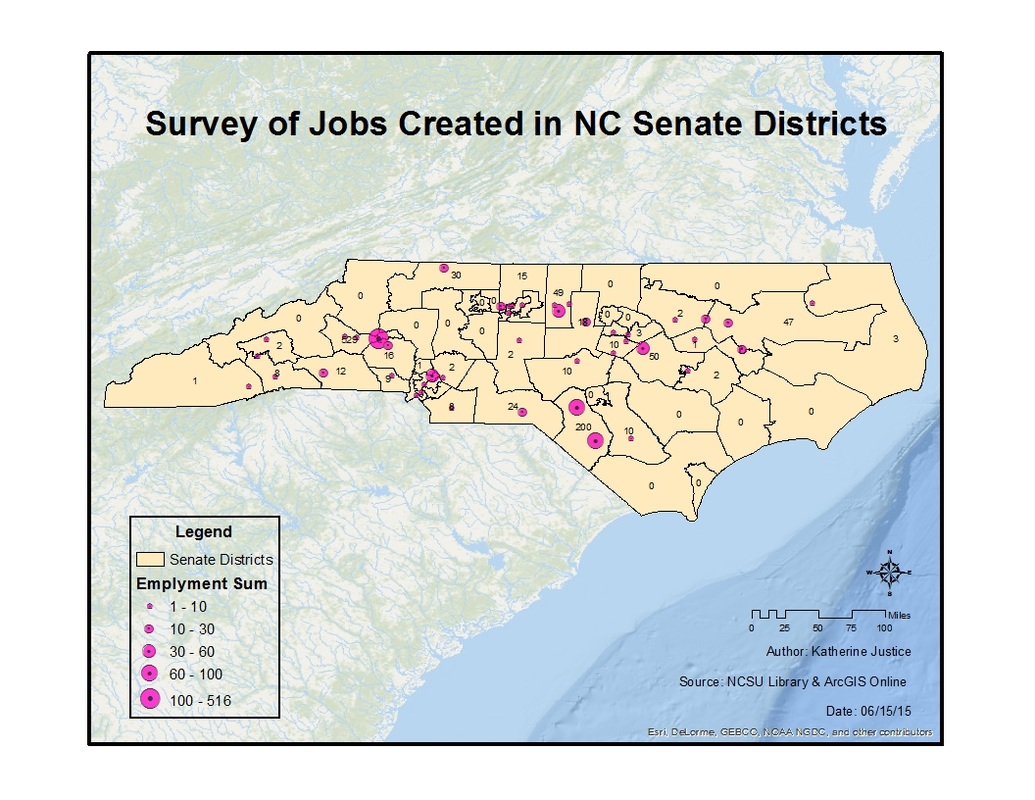
Map 2: Shows the number of jobs created in the North Carolina Senate Districts based on the Employment Survey data table.
Application & Reflection
The skill sets developed in this exercise has helped me to better understand building spatial and tabular joins in real life applications. I could see this type of analysis being used at a wider scale for political or social economical purposes. For example, a fast food company might use a tabular survey of areas in poverty to create a spatial join to potential site areas for construction.
